The previous post Troubleshooting virtual machines included a brief introduction to ESXTOP and I realized quickly that I should elaborate on the topic, so lets dig in.
ESXTOP is a built in real time ( 5 second refresh interval) utility that allows you to see exactly what your ESXi Host is doing. In this post we will explore the capabilities and use cases leveraging this Tool.
The Command is simple its ESXTOP,
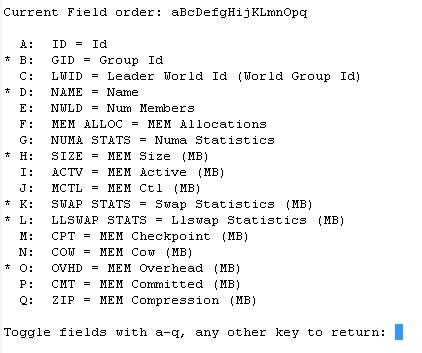
As a quick primer you will want to know how to move around within the tool so well start off with a command matrix. The below chart basically states if you press the letter associated with the resource you will get that resource displayed as output for example. Once you type in the initial ESXTOP command you will see the below out put.
Now that you see this wealth of information, what do you do with it and how do you move forward. The below chart is defiantly your starting point.
c – CPU screen
m – memory screen
d – disk adapter screen
u – disk device screen
v – virtual disk view
n – network screen
V – virtual machine view
h – help
q – quit
Now well look at some of the results you will see once you select the specific letter that is associated with the resource in question.
The below example is the output from selecting the “m” key to view memory statistics. As a reminder the memory reclamation process is also shown below starting with transparent page sharing that is rather normal, and disabled by default and end with swapping which will incur a performance impact. Also note that you must have VMware tools running on your virtual machines to leverage this memory management process.
transparent page sharing
ballooning
compression
swapping
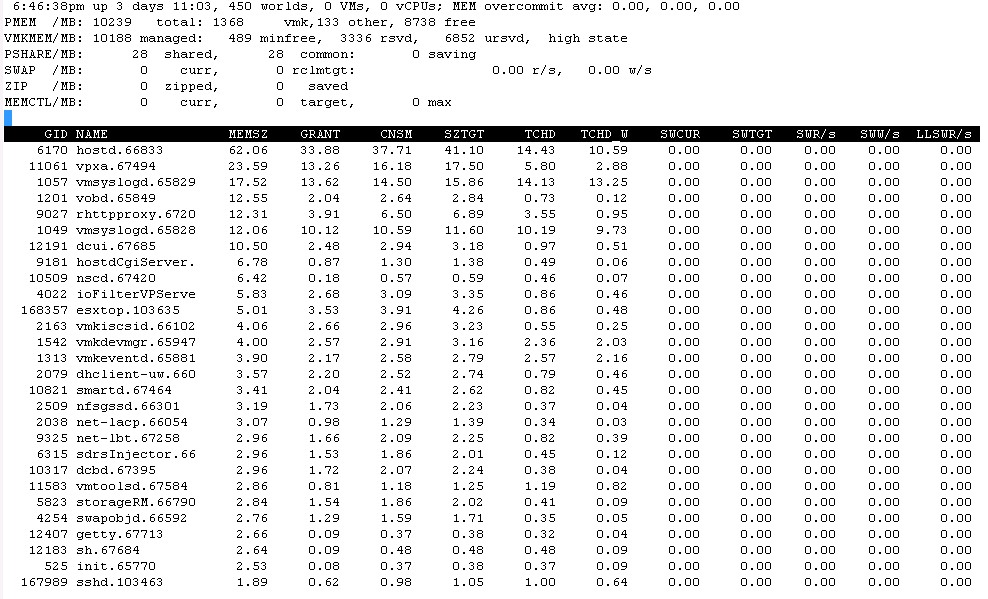
And because memory has historically been the culprit for performance issues we will dig in some more here. Now that your here please select the “F” key. Next you will be displayed with the following screen that further defines what is happening with our memory. Lets keep in mind the 5 memory states as well during the investigation. High, clear, soft, Hard and low are the 5 memory states.
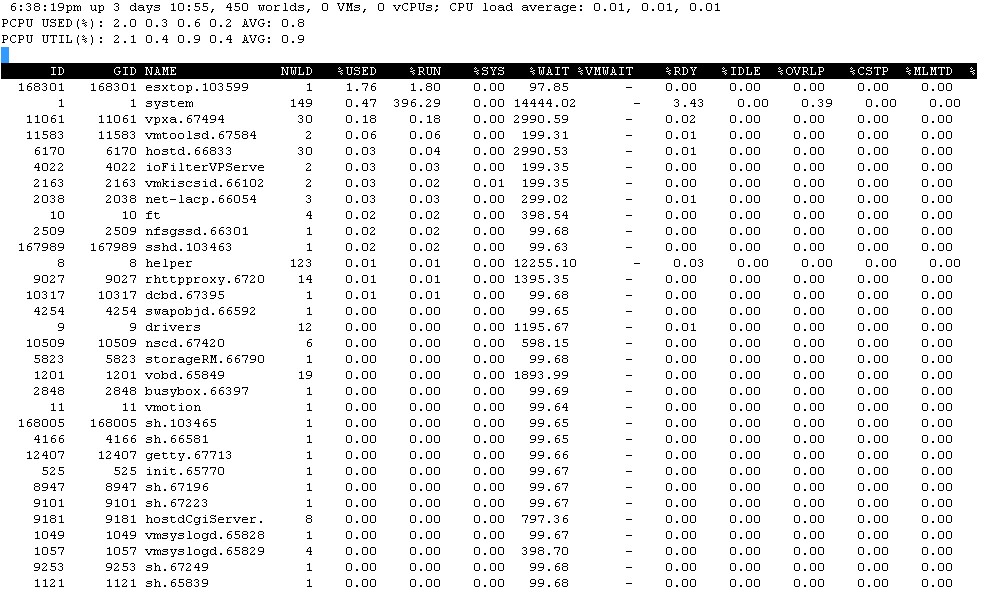
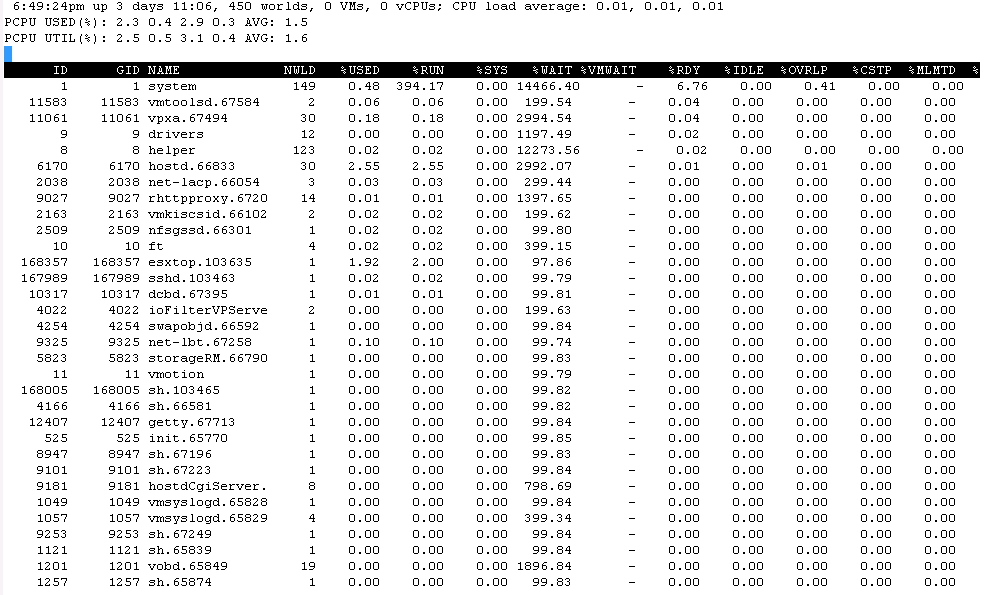
The next example is the output from selecting the “C” key to view CPU statistics
Note: Always remember the “h” key, it will always provide you additional guidance as you narrow down where the potential issue may reside.